
Unlock your Tableau data sources for the rest of your stack
Move your Tableau math into Snowflake. Serve it everywhere.
In the last post, we wired Sigma directly to Tableau's VizQL Data Service. One click in a Sigma workbook, the math runs in Tableau, both surfaces show the same numbers. It works, it's the right shape for ad hoc lookups, and it's what we'd recommend for action-time enrichment.
But it's not the right shape for production reporting. Every Sigma viewer triggers a fresh VDS call. Workbook open time is bounded by VDS response time. Failures cascade into the user-facing workbook as broken visuals. And the 100-queries-per-hour-per-Creator cap on VDS quietly becomes the ceiling on how many viewers your workbook can serve.
This post covers the durable version of the same idea. Snowflake calls VDS on a schedule, lands the rows in a table, and exposes a view. Sigma reads the view. Same Tableau-canonical numbers. None of the runtime fragility.
The arc here is also bigger than Sigma. Once your Tableau math is sitting in Snowflake, Sigma is just one of the things that can read it. dbt models can build on it. Reverse ETL can push it back to Salesforce. ML pipelines can feature-engineer against it. Any other BI tool, any notebook, any embedded analytics layer, anything you build next year, all of it gets the same numbers without anyone having to recreate the calc logic. That's the broader thing this pattern unlocks, and it's why we think the Snowflake path matters even for organizations that don't use Sigma.
The problem this actually solves
The narrow problem we set up in the first post is metric drift across tools. Profit ratio is 14.97% in Tableau and 14.91% in Sigma because filters, joins, and rounding rules drifted as the metric got recreated in a second tool. That problem doesn't go away just because the calc lives in Snowflake. It goes away because the calc still lives in Tableau and Snowflake is just storing the result.
The wider problem is that Tableau data sources tend to become locked rooms. Years of careful work goes into getting them right. Filters defined correctly. Calculations that reflect actual business logic. Joins that account for the awkward edge cases nobody documented. And then all of that value sits inside Tableau, accessible only to Tableau Desktop users, only inside Tableau workbooks, only at viewer-action time.
When the inevitable next tool shows up (a Sigma migration, a dbt rebuild, a CRM integration that needs the same canonical numbers), teams either rebuild the logic from scratch and accept that the numbers will drift, or they rebuild it carefully and accept that it'll drift on the next change. There's no good third option without something like this pattern.
VDS plus Snowflake gives you the third option. Tableau stays the source of truth for the math. Snowflake becomes the distribution layer. Anything that talks to Snowflake gets the right answer.
What this gets you
A few specific things, in rough order of how often we see them matter:
Decoupling viewer experience from Tableau availability. When the Snowflake task fails, your Sigma workbook serves yesterday's numbers with a stale-as-of timestamp. When VDS-at-runtime fails, your workbook is broken and your users file tickets. Stale data with a known timestamp is almost always better than a red error icon.
Throughput. One VDS call per refresh instead of one per viewer. The 100/hour rate limit stops being a ceiling on dashboard adoption. If you have 200 people opening a Sigma workbook between 9 and 10 AM, you don't make 200 VDS calls; you make zero, because the data was refreshed at 4 AM.
Audit and replay. Every batch lands in a raw table tagged with a UUID, an ingest timestamp, and the full unprocessed VDS response. When someone questions a number, you can show exactly which API response produced it. When the staging logic changes, you can rebuild the staging table from raw without re-hitting Tableau.
Permission decoupling. Snowflake controls who reads what, independent of Tableau permissions. The Sigma service account doesn't need a Tableau seat. The dbt account doesn't need a Tableau seat. Your data scientists exploring in a notebook don't need Tableau seats. They all need Snowflake access, which they probably already have.
Cross-tool consistency. The most underrated benefit. The Snowflake view becomes the canonical source for the metric across every consumer. Sigma, dbt, reverse ETL, ML, embedded analytics, internal apps. Same numbers everywhere because they all read the same view, which contains the result of the same VDS call, which ran the same calc Tableau has always run.
Reduced vendor lock-in. This is worth saying directly. If you ever migrate off Tableau, you don't lose the value of your data sources overnight. The Tableau math has been writing itself to Snowflake on a schedule. The view contract Sigma reads from doesn't care whether VDS is still on the other end of it next month or whether you've replaced it with a dbt model. You buy yourself optionality without giving up the canonical numbers.
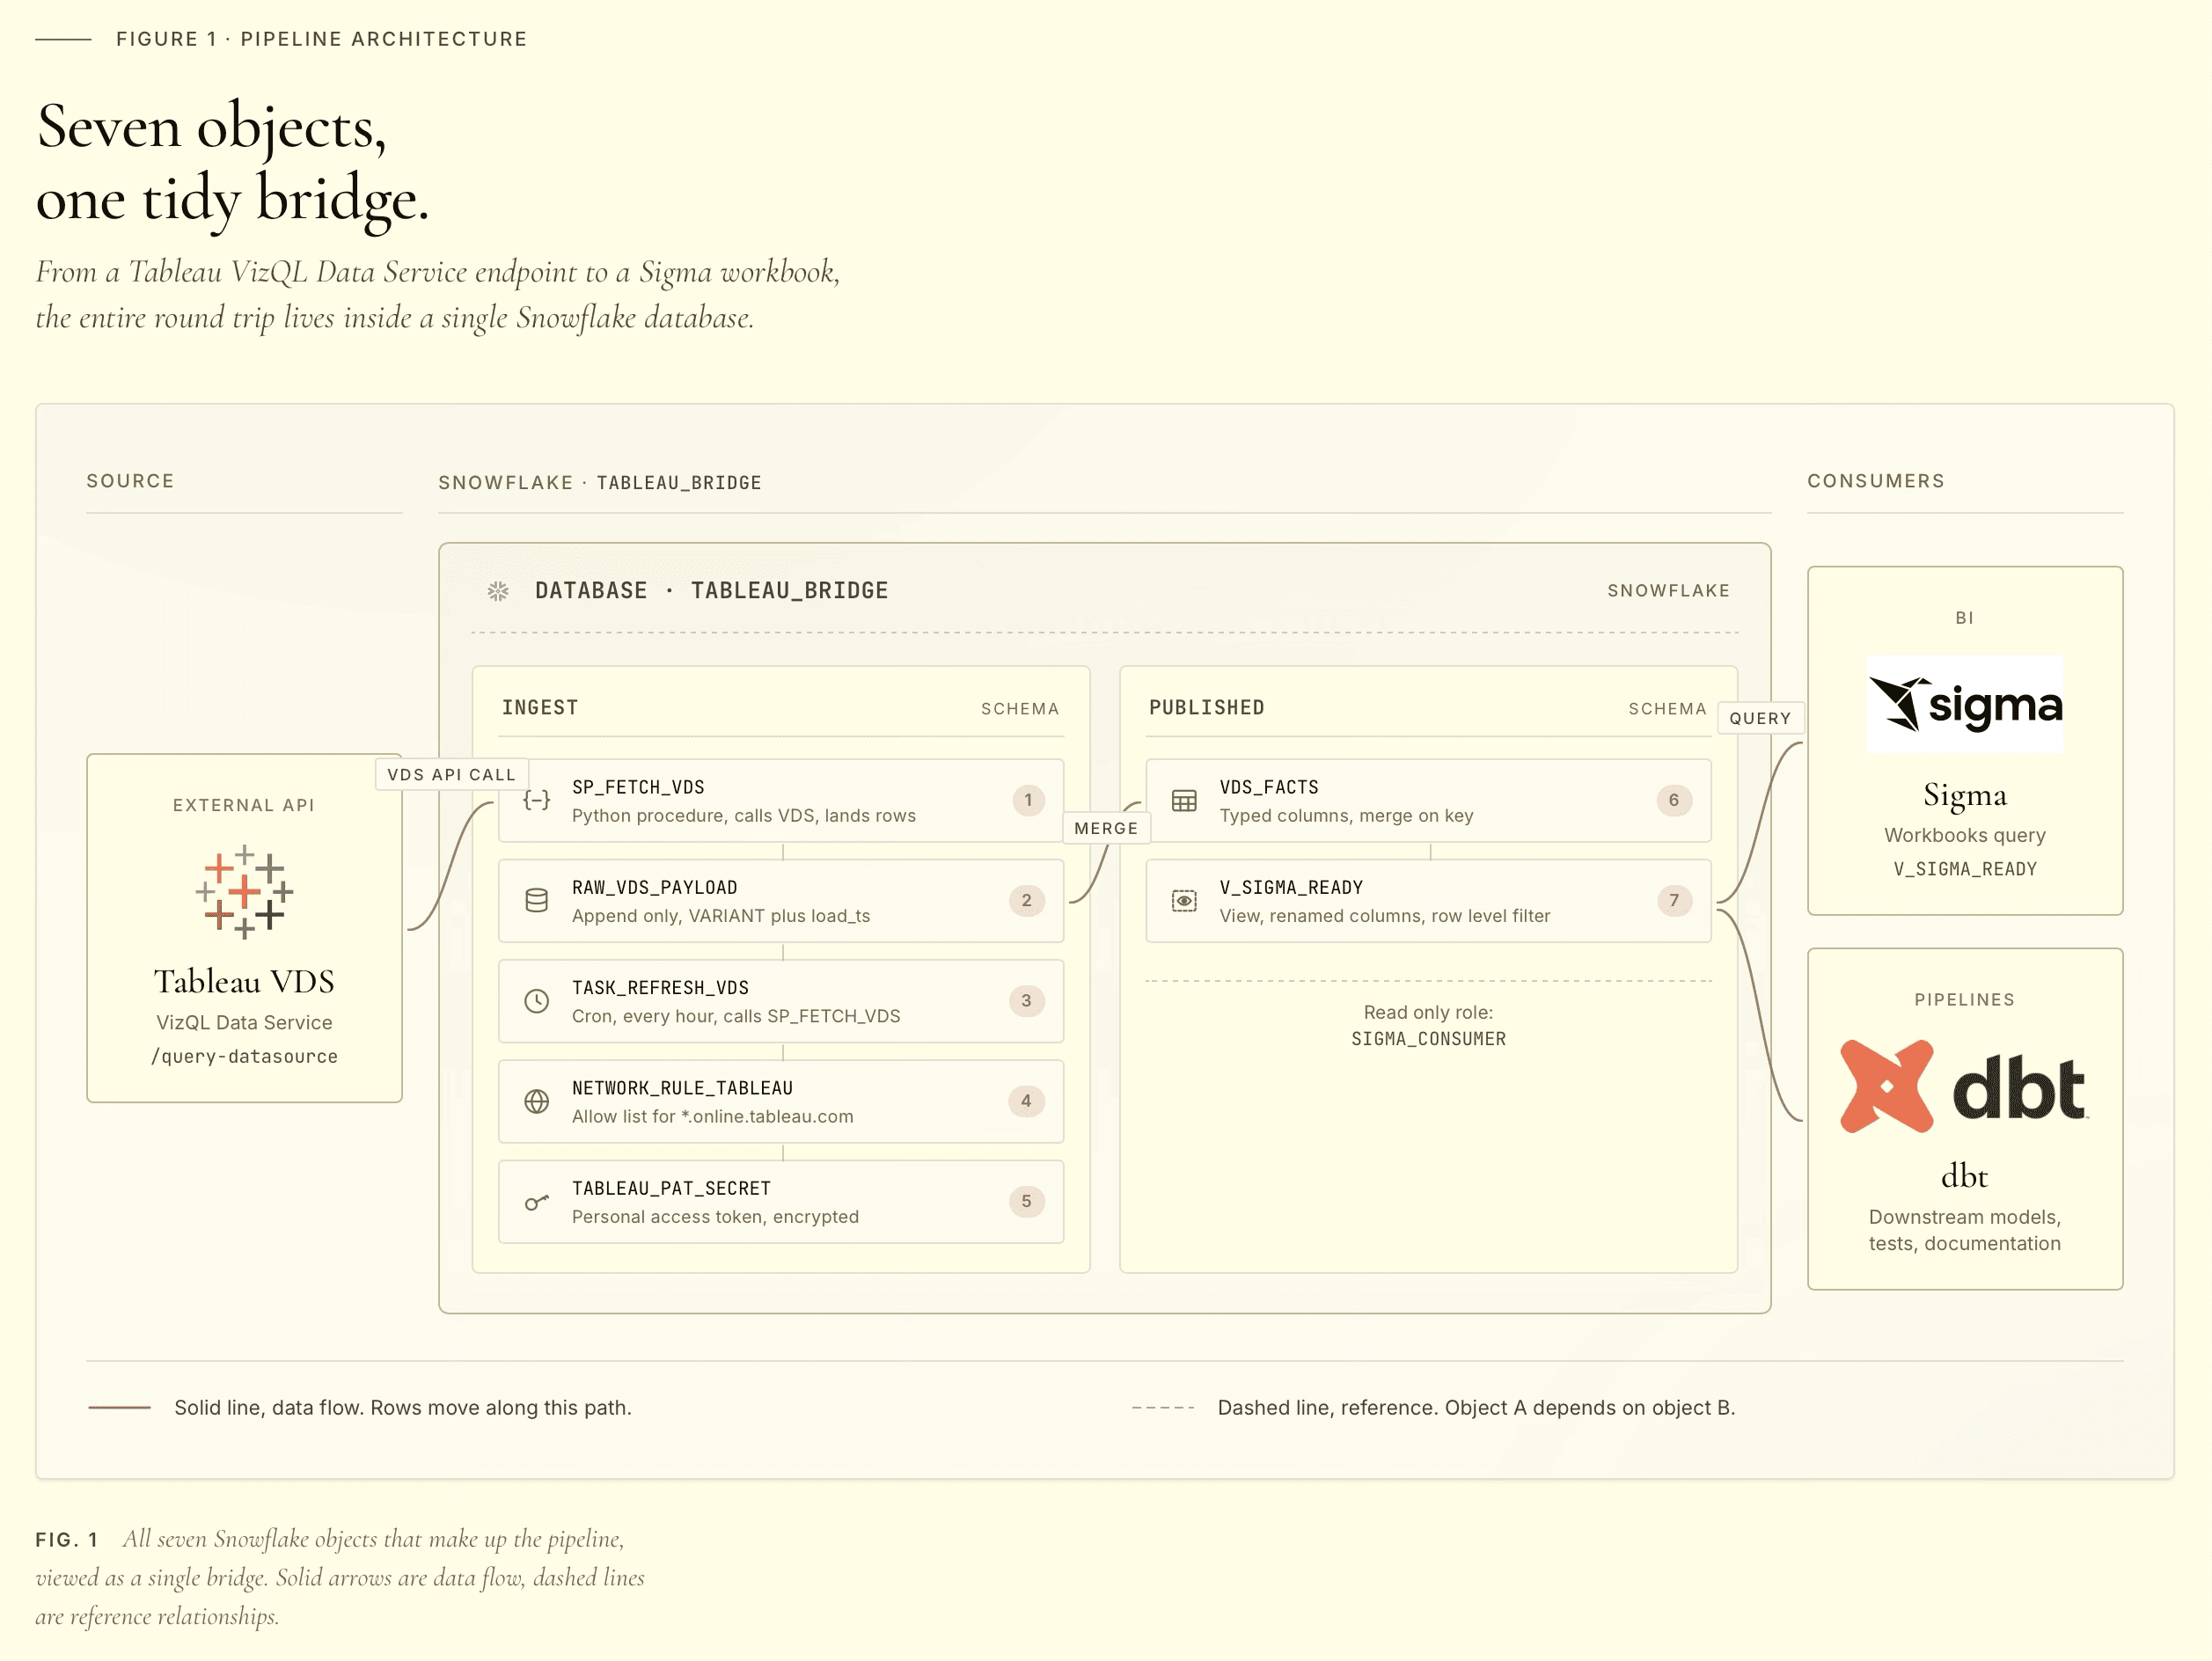
Architecture
The pieces, top to bottom:
A network rule that whitelists egress to your Tableau Cloud pod. By default, Snowflake stored procedures cannot make outbound network calls. The rule is what authorizes the egress.
A secret holding your Tableau Personal Access Token. Stored as a JSON blob containing both the PAT name and the PAT secret, because both are needed at signin and atomic rotation is easier than coordinating two separate secrets.
An External Access Integration (EAI) that ties the network rule and the secret together so a procedure can use both. Procedures reference the EAI by name in their definition.
Two tables. A raw landing table that holds the full VDS payload as VARIANT, and a typed staging table with one column per Tableau field. Keeping them separate is what makes replay possible.
A Python stored procedure that signs in to Tableau with the PAT, calls VDS, lands the response in raw, flattens it into staging, and signs out. All in one transaction.
A view in a separate read-only schema that exposes the latest batch to Sigma. Sigma reads from the view, never from the staging table directly. The view is the contract.
A task that runs the procedure on a CRON schedule.
What you'll need
Before the build:
On the Tableau side. A Personal Access Token created on a user with the API Access capability on the data source. The PAT name and secret in hand. Your pod (the subdomain in your Tableau Cloud URL, like 10ay). Your site contentUrl (the bit after /site/ in the URL). The data source LUID (visible at the end of the data source URL when you're viewing it in the Tableau Cloud UI).
On the Snowflake side. ACCOUNTADMIN access for the initial setup, because external access integrations and security integrations are account-level objects. Standard edition or higher. A warehouse the procedure can use; the examples below assume COMPUTE_WH. About fifteen minutes if you're copy-pasting the SQL below.
One philosophical caveat. This setup gives the pipeline broad privileges on the account. That's the right call for a dedicated demo environment. If you're rebuilding this against a production account, scope the role down to the specific schemas before granting ACCOUNTADMIN-level privileges.
The build
Everything you need is below. Run the SQL blocks in order. After each block, verify it worked before moving on; the verification queries are noted where useful. If you want to script this for replay later, save the file separately. For your first run, paste each block into a Snowsight worksheet directly so the secret value stays out of any client history you'd rather not retain.
Database, schemas, role
Create a database with two schemas. INGEST holds the plumbing (raw, staging, the procedure, the task). PUBLISHED holds only views Sigma reads. Sigma's service account needs USAGE on PUBLISHED and SELECT on the views inside it; it never needs to see the raw payloads.
The split is intentional. INGEST changes frequently. PUBLISHED is the contract surface. If Sigma reads from PUBLISHED, you can refactor INGEST without breaking downstream consumers.
Network rule
Substitute your pod for <your-pod>. Real pod values look like 10ay, dub01, or us-east-1 and appear as the subdomain in your Tableau Cloud URL. The rule is locked to a single hostname.
Secret
The PAT goes into a single secret as a JSON blob. Atomic rotation; one CREATE OR REPLACE replaces both name and secret.
Run this in Snowsight directly, not from a checked-in script. The secret value never appears in Snowflake's logs after creation, but it appears in your client history if you script it.
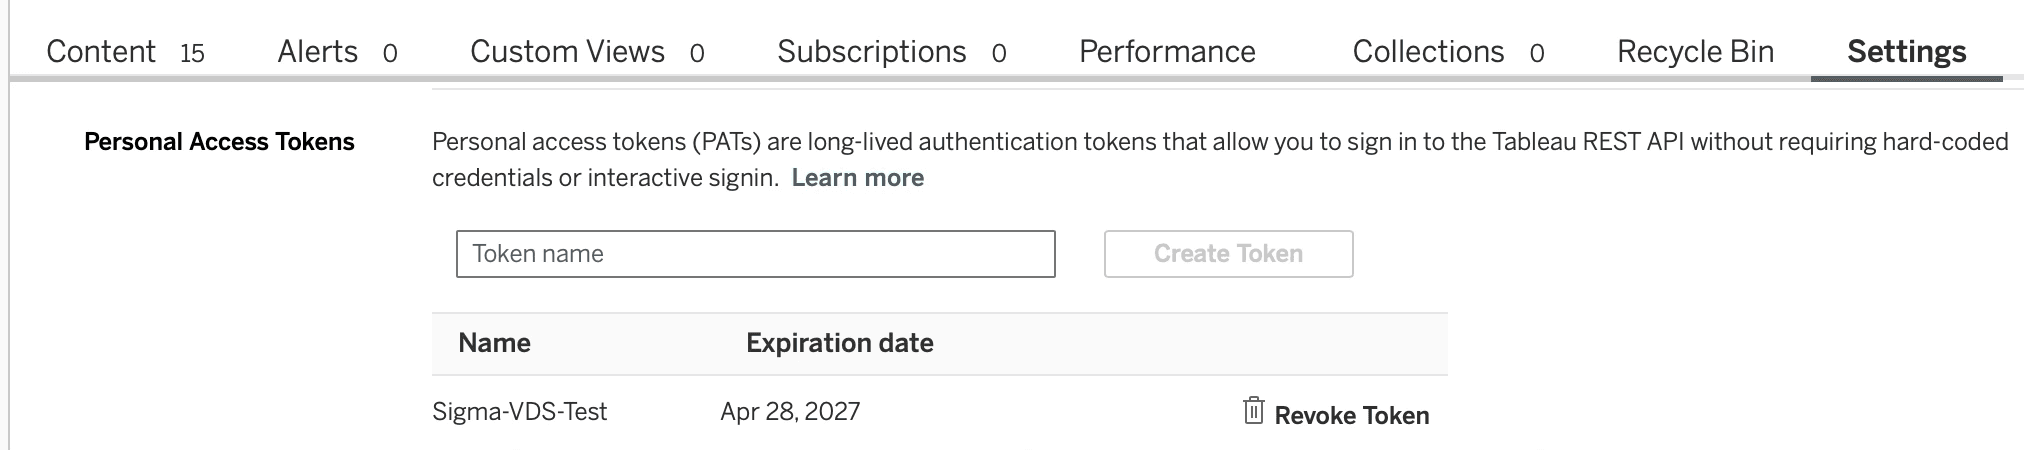
Creating the PAT in Tableau Cloud. The secret is shown once and only once at creation; copy it before closing the dialog.
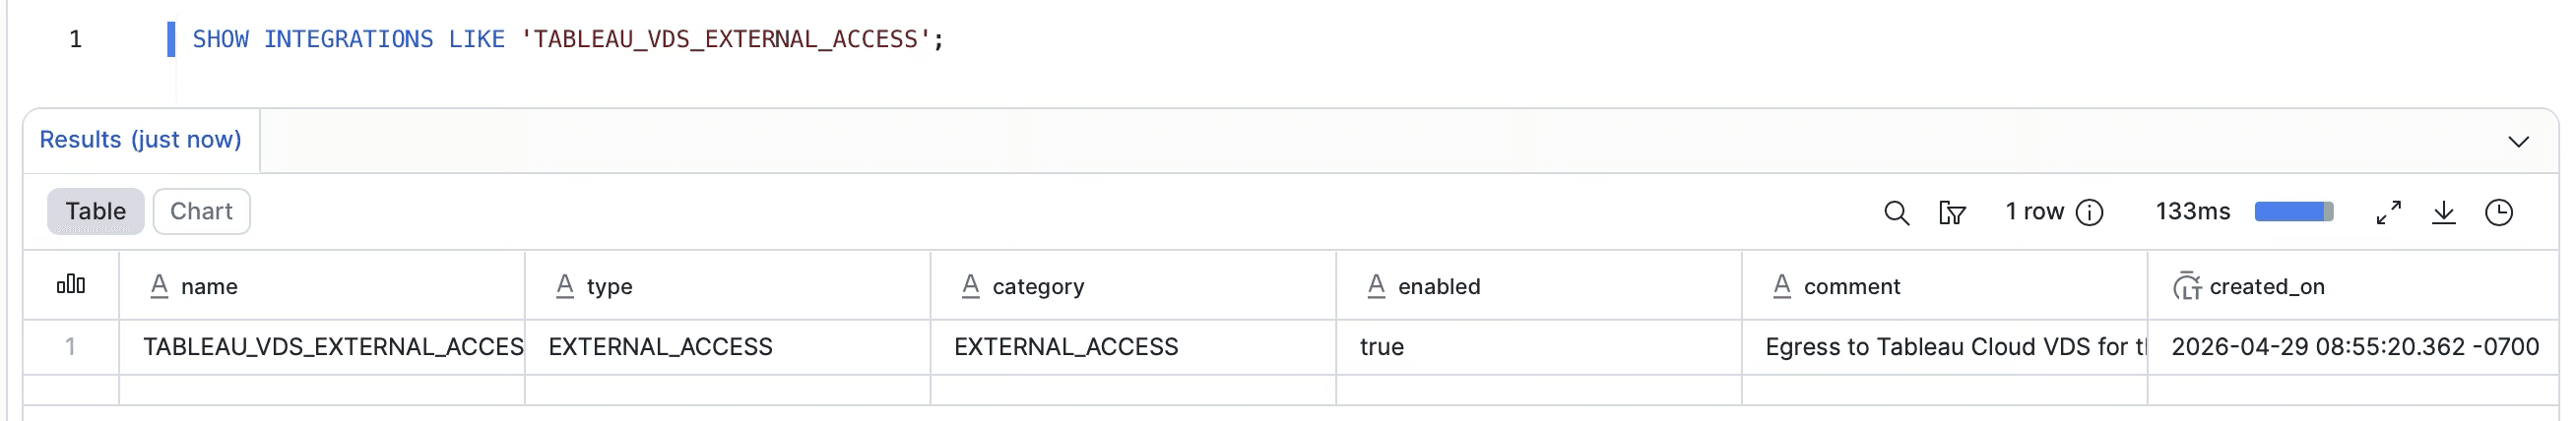
External Access Integration
The External Access Integration ties the network rule and secret together so the procedure can use both.
Tables
The raw landing table holds full payloads as VARIANT:
The staging table has one column per Tableau field, typed:
One naming convention worth pointing out: the per-row Profit Ratio gets a _ROW suffix because in disaggregate mode VDS returns Profit/Sales per row, not the aggregate SUM(Profit)/SUM(Sales). The suffix is a loud signal to downstream consumers to compute the aggregate ratio in their own query, not by averaging this column.
If your data source has fields beyond Superstore's, you'll need to expand this column list to match. There's a metadata-discovery procedure later in the post that pulls the full field catalog from VDS for any data source you point it at.
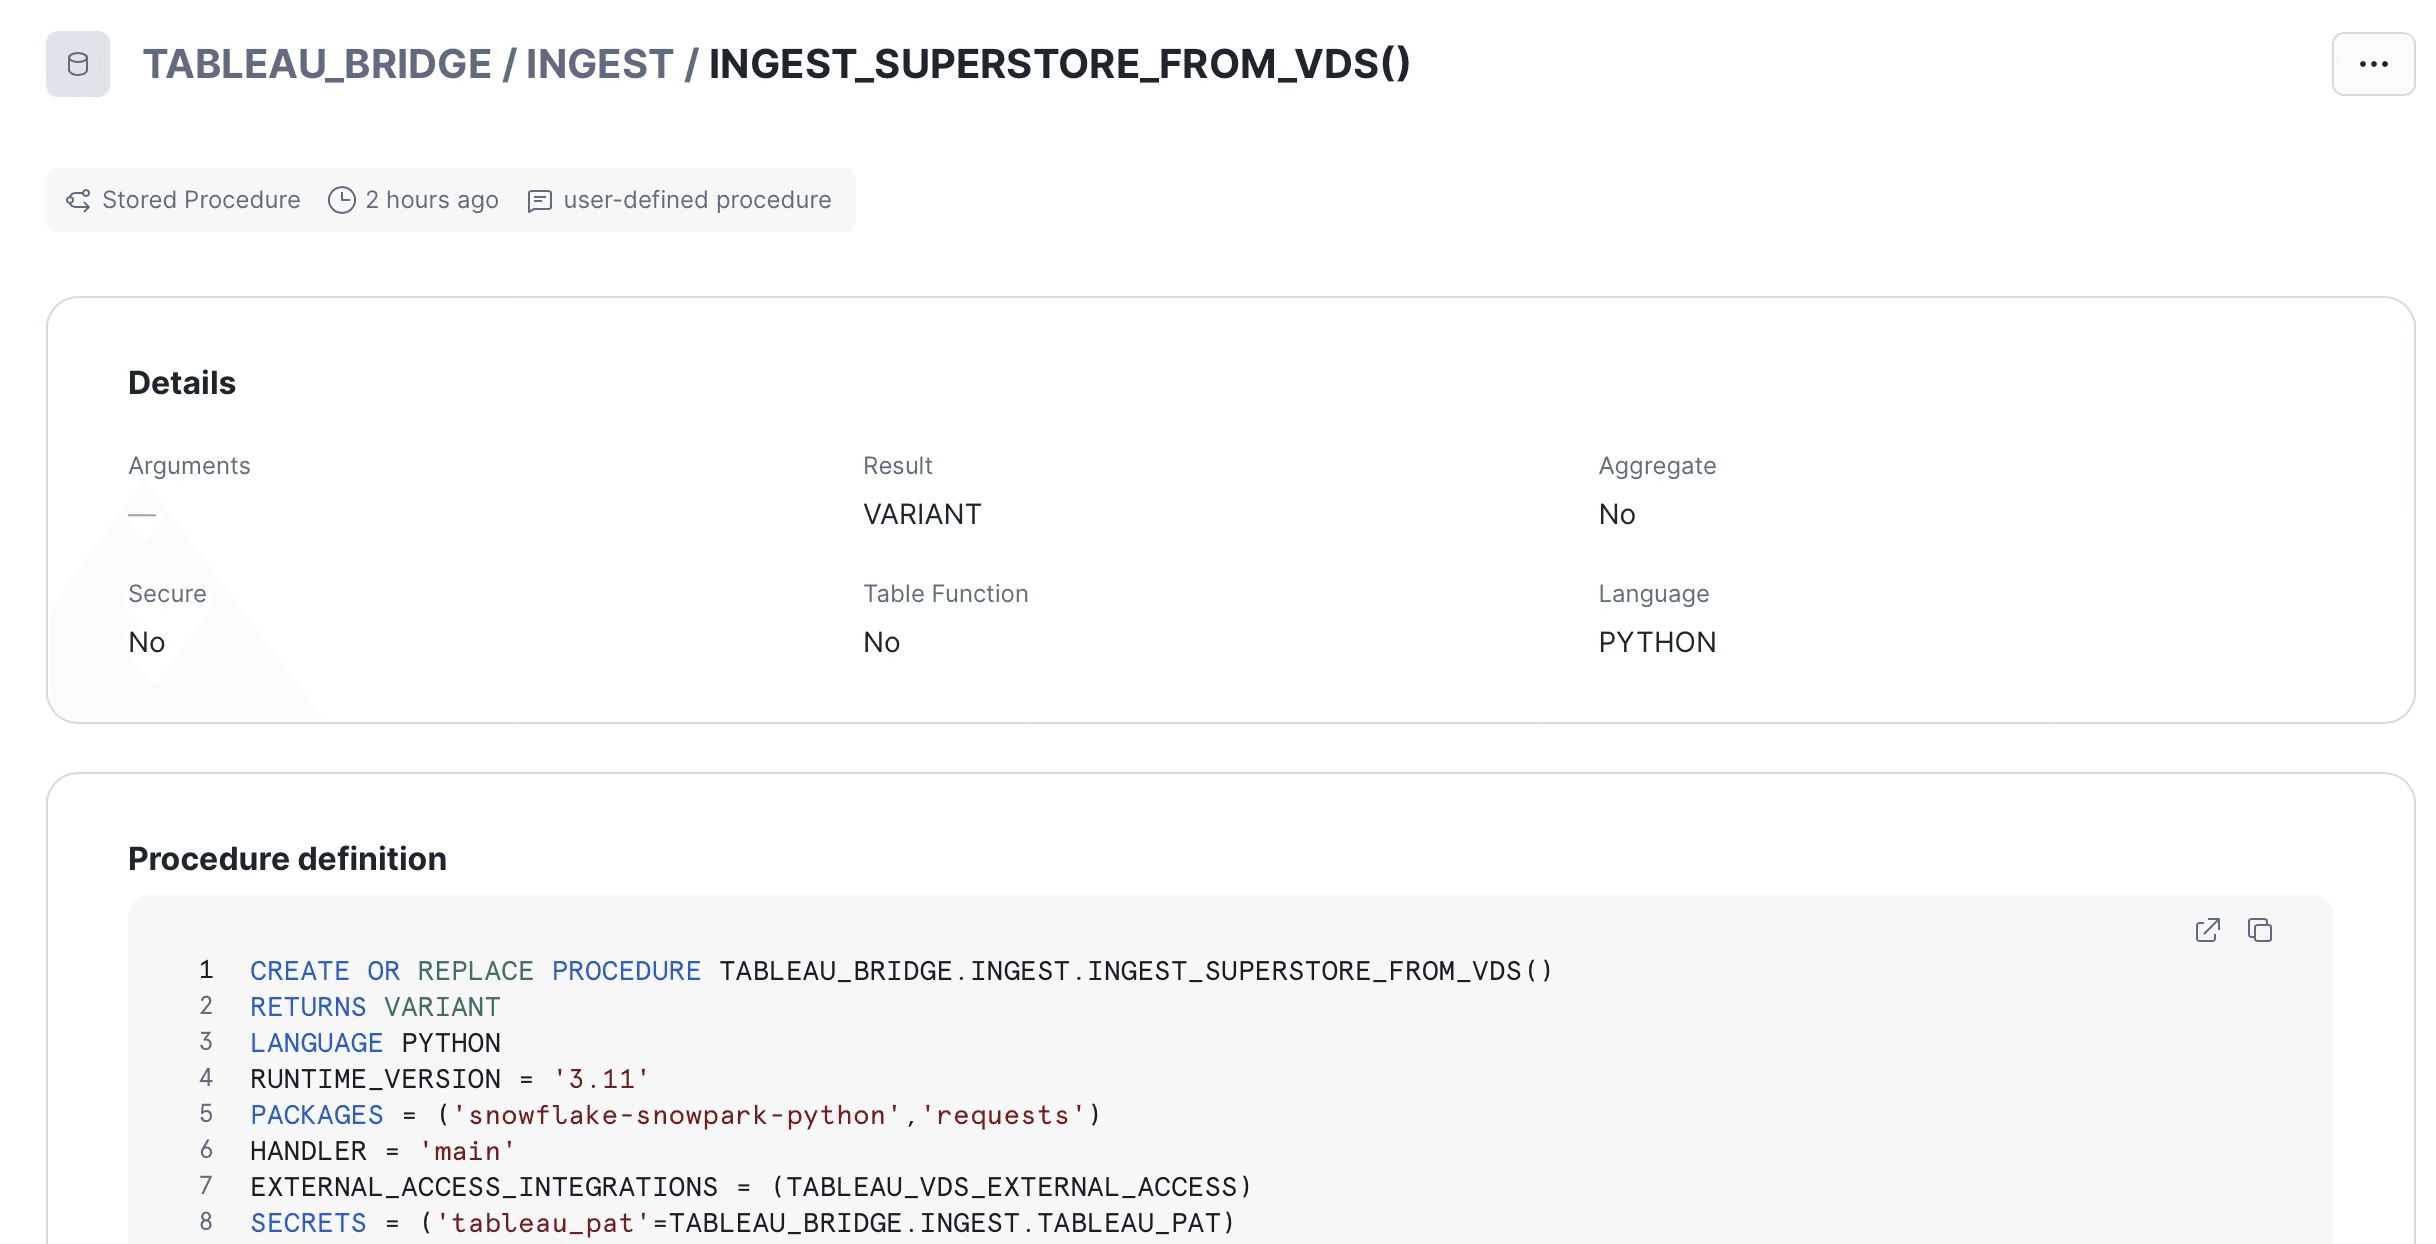
The ingestion procedure
This is the engine. It signs in to Tableau with the PAT, calls VDS, lands raw and staged in the same transaction, signs out. Long, but every line earns its place.
A few design choices worth calling out:
The disaggregate: true option in the VDS query body is the most important option in the entire pipeline. Without it, VDS returns pre-aggregated numbers that lose row-level detail. With it, you get one row per source record, which is what makes downstream sums in Sigma or anywhere else reconcile to canonical Tableau values. Get this wrong and your numbers will look approximately right but be subtly off, which is worse than an obvious failure.
Sign-out in a try/finally. If the VDS query throws, we still release the Tableau session token. They time out on their own, but we don't want them sitting open.
Two-step landing. Raw first, then staging derived from raw via LATERAL FLATTEN over the VARIANT. Both writes happen in the same procedure call, sharing a transaction. If staging fails, raw still has the payload for replay.
Parameter binding in the INSERTs. Parameters, not string interpolation. Avoids quote-escaping issues with customer names like "O'Brien" and prevents anyone from getting clever with SQL injection through field captions.
The procedure declares its EAI and secret bindings at definition time. The binding name
tableau_patis what_snowflake.get_generic_secret_string()reads at runtime.
View
The view exposes only the latest batch. Older batches stay in staging for retention and debugging, but anyone reading the view always sees the freshest snapshot. BATCH_ID is intentionally not surfaced; downstream consumers don't need to know how the data got there, just that it's there and it's current. INGESTED_AT is exposed so consumers (or operational dashboards) can show data freshness without having to join back to staging.
Task
Daily at 4 AM Central. Adjust to whatever your data freshness requires. The 45-minute timeout is generous for Superstore (which returns in seconds) but matches what you'd want for larger sources. Auto-suspend after three consecutive failures so a quietly broken pipeline doesn't burn credits indefinitely.
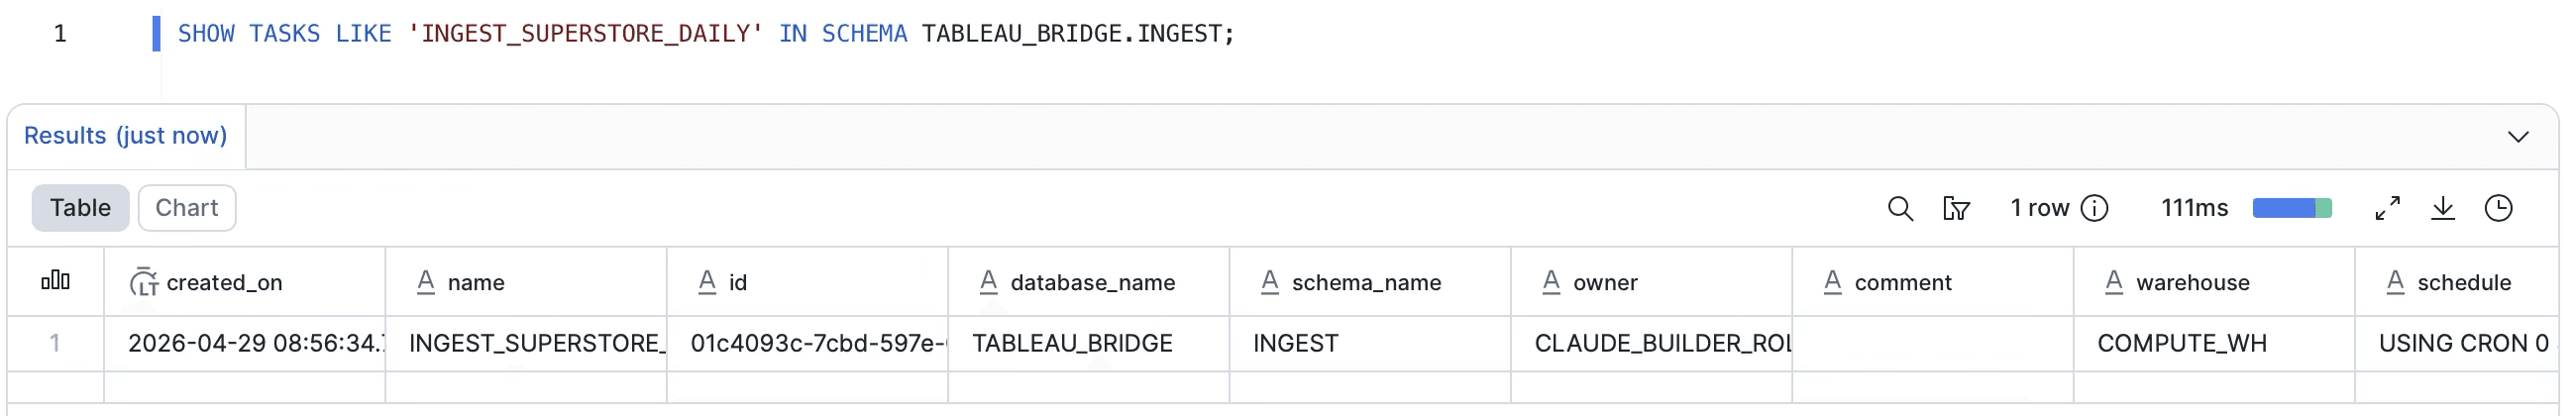
Task scheduled and running. State
startedmeans the task is enabled and waiting for its next CRON window.
The acceptance test
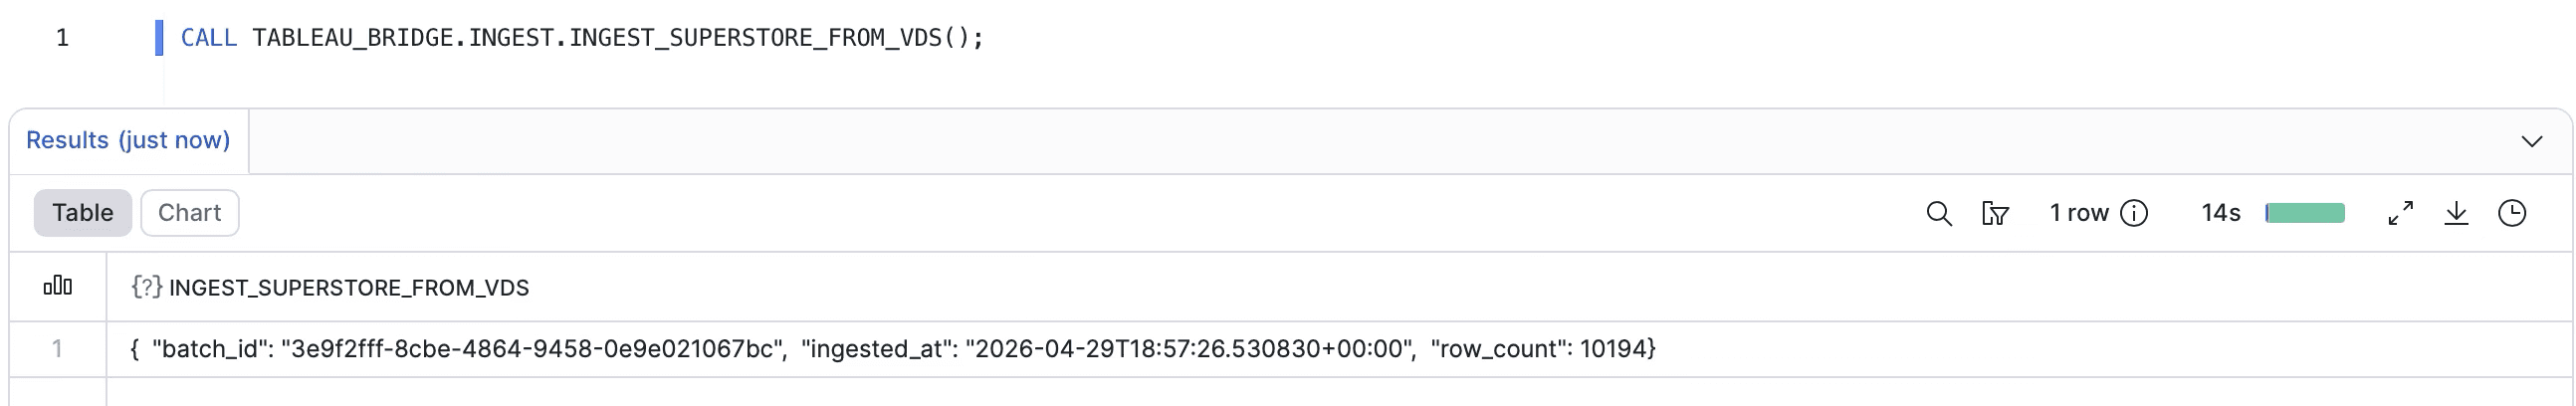
Run the procedure once manually before trusting the schedule:
Expected return: a JSON object with batch_id, row_count, and ingested_at.
First successful run. The procedure returns the batch UUID, ingest timestamp, and row count.
Then verify the rollup against Tableau:
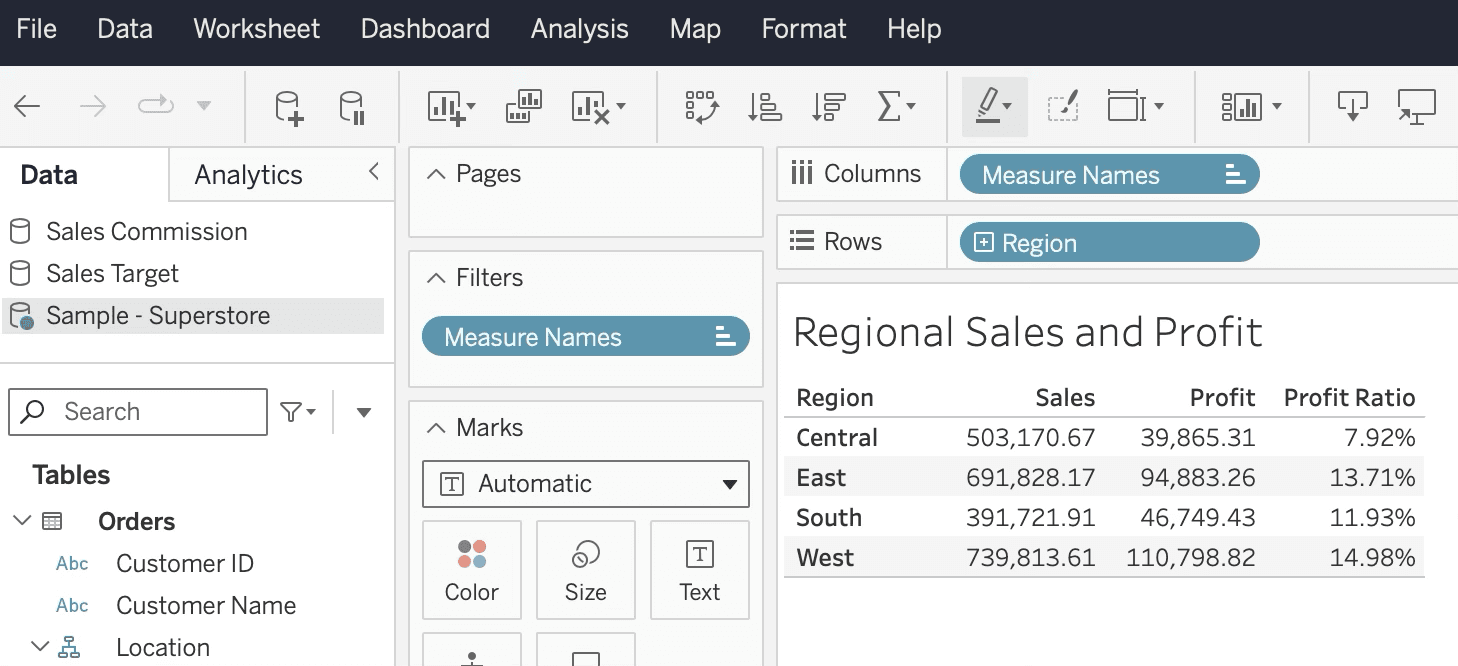
Numbers from the Tableau workbook against the same data source:
Region | Sales | Profit | Profit Ratio |
|---|---|---|---|
Central | $503,170.67 | $39,865.31 | 7.92% |
East | $691,828.22 | $94,883.26 | 13.71% |
South | $391,721.90 | $46,749.43 | 11.93% |
West | $739,813.61 | $110,798.82 | 14.97% |
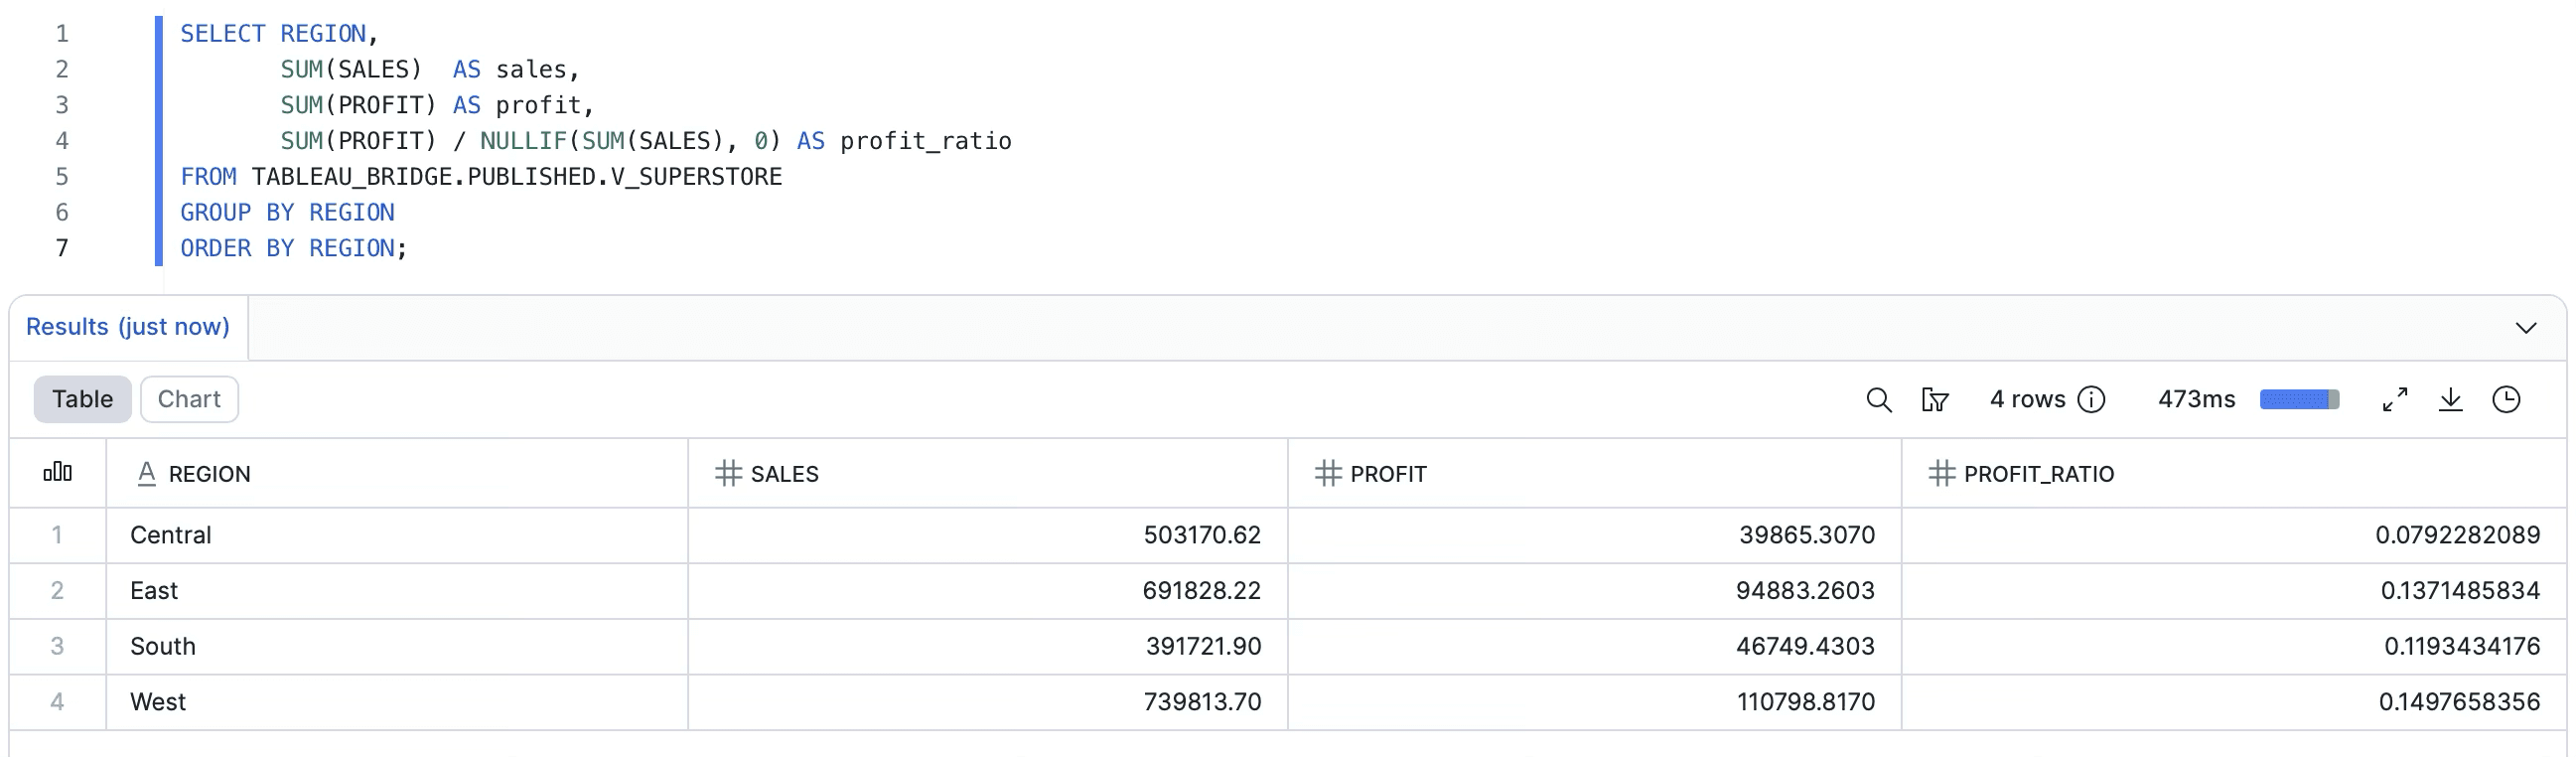
Numbers from Snowflake after the pipeline runs:
Region | Sales | Profit | Profit Ratio |
|---|---|---|---|
Central | $503,170.62 | $39,865.31 | 7.92% |
East | $691,828.17 | $94,883.26 | 13.71% |
South | $391,721.91 | $46,749.43 | 11.93% |
West | $739,813.70 | $110,798.82 | 14.98% |
Profit is bit-exact. Sales is a few cents off the target ($739,813.70 vs $739,813.61), which is row-level rounding from the NUMBER(18,2) cast at staging time, not a VDS precision issue. Profit Ratio rounds to 14.98% vs the 14.97% target, which is the same delta propagating into the denominator.
If you need bit-exact reconciliation on Sales, widen the column to NUMBER(18,4) to match how Profit is stored. The trade-off is a slightly larger storage footprint and a possible Sigma display preference for two decimals.
Snowflake rollup against the latest batch. West reconciles to Tableau within rounding tolerance.
The same rollup in Tableau. Same source, same engine, same numbers.
When your data source isn't Superstore
If you're following along with the canonical Superstore data source, the field projection above just works. If you're applying this pattern to your own published data source (which is almost certainly the actual reason you're reading this post), you need to know what fields are available, what their captions are, and what type each one returns.
VDS exposes a metadata endpoint that returns exactly that. Drop in this companion procedure and call it once whenever you need to refresh your understanding of a data source:
Call it with the LUID of the data source you want to inspect:
The response is a JSON object listing every field VDS exposes along with its fieldCaption, dataType, columnClass (COLUMN, CALCULATION, GROUP, BIN, SET, etc.), and which logical table it belongs to. From there, building the field projection in the main ingestion procedure is a translation exercise: each entry becomes a {'fieldCaption': '...'} line in QUERY_FIELDS, and a typed column in the staging table.
One thing to watch for: the metadata response is not guaranteed to be exhaustive. We hit cases on Superstore where Customer ID and Product ID returned values when included in a VDS query but didn't appear in the metadata listing. If a field exists in your Tableau workbook and you can see it being used, but discovery doesn't show it, just include it in the projection anyway and see if VDS returns it. It usually does.
A few things we learned
The Snowflake side of this build was cleaner than the Sigma-direct path in the first post, but it has its own set of gotchas worth knowing about before you hit them.
The Returns join is implicit. Standard Superstore has 9,994 rows. Our pipeline returned 10,194. The Returns logical table joins on Order ID whenever any Orders field is queried, regardless of whether you select a Returns column. The 200 extra rows are orders with multiple return rows in the Returns table. This is a Tableau data source design behavior, not a VDS bug. If you need to suppress the duplication, filter at the VDS query level using the filter clause in the VDS body, not after the fact in Snowflake.
Disaggregate mode collapses calculated fields. The Profit Ratio calc in Tableau is SUM([Profit])/SUM([Sales]). With disaggregate: true, that returns Profit/Sales per row instead of the aggregate. Reason: disaggregate tells VDS to skip its aggregation entirely and return one row per source record, so any aggregate-bearing calc collapses to its row-level equivalent. The fix is to push aggregate computations to the consumer (Sigma, dbt, your notebook) using SUM(Profit)/SUM(Sales). The naming convention with the _ROW suffix on the column name is meant to make this loud at the schema level.
Number precision matters at the column type level. Each Sales row gets truncated to two decimals because the column is NUMBER(18,2). Across thousands of rows this introduces small rounding error in aggregates. We saw nine cents on $739K, which is immaterial for most use cases. If you need bit-exact reconciliation, widen all monetary columns to NUMBER(18,4).
Row ID isn't always exposed. Some Tableau-published data sources hide Row ID from VDS metadata. Superstore does. If you need a row-level join key, you have two options: republish the source with Row ID unhidden, or synthesize a deterministic key in staging (Order ID concatenated with Product ID and a sequence number).
PAT expiry is silent until it isn't. Tableau Personal Access Tokens expire after 15 days of inactivity by default. The daily task keeps it active. If you suspend the task for more than 15 days, the PAT will need regeneration and the secret will need rotation. Add a calendar reminder or, better, alert on consecutive task failures.
Beyond Sigma: what this pattern enables
The Sigma side of the demo is a single workbook that connects to Snowflake and reads from V_SUPERSTORE. The KPIs match Tableau because the data physically came from VDS. We'll cover that build in the next post. But focusing only on the Sigma case undersells what's actually being unlocked here.
A few of the other consumers a single Snowflake table unlocks, in rough order of how often we see organizations actually do this:
dbt models that build on Tableau-canonical inputs. Your dbt project can ref() a source that points at V_SUPERSTORE, and any model downstream of it inherits the Tableau math. This is the cleanest answer to the question "where should the canonical metric live, in Tableau or in dbt?" Answer: in Tableau, but materialized into the warehouse where dbt can see it.
Reverse ETL pushes back into operational tools. Census, Hightouch, or your equivalent can pick up V_SUPERSTOREand sync it to Salesforce, HubSpot, or an internal CRM. Sales reps see the same Profit Ratio that finance sees in their Tableau dashboards. Same number, same engine, just delivered to the right surface.
ML feature pipelines. Training data for a profitability model that wants to use the same Profit Ratio definition the business already trusts. Pull from V_SUPERSTORE, join to your other warehouse tables, train. The features are calculated identically to what the business sees.
Other BI tools. All of them can hit Snowflake. None of them need a Tableau seat to see the canonical numbers.
Embedded analytics. Customer-facing dashboards in your own product. Whatever embedding layer you use (Sigma embed, Tableau embed, custom React with a charting library), the numbers it shows can come from V_SUPERSTOREinstead of being recreated in your application logic.
Internal apps and notebooks. Engineers querying the warehouse from a Jupyter notebook to investigate a customer issue. Internal tools that surface "what did this customer order, what did we make on it" without anyone having to log into Tableau to find out.
The pattern that connects all of these is the same. Snowflake becomes the metric distribution layer. Tableau remains the metric definition layer. Anything that can read Snowflake gets the Tableau-correct answer.
That separation also gives you something subtle but important: portability. If you ever move off Tableau, you don't lose your data sources overnight. The view in PUBLISHED doesn't care whether VDS is still on the upstream side of the procedure; you can swap the procedure for a dbt model later and Sigma never notices. You buy yourself optionality without paying for it now.
When to use Path A versus Path B
We get this question every time we discuss this pattern with a client. There's no single right answer, but here's how we tend to think about it.
Use Path A (Sigma calls VDS directly) when: the consumer is one specific Sigma workbook, the audience is small (a handful of analysts, not the whole org), the data is small, the freshness requirement is action-time, and you can tolerate workbook open time being bounded by VDS response time. It's the right shape for ad hoc lookups and small-team workflows.
Use Path B (VDS to Snowflake, this post's pattern) when: the metric needs to be consumed by more than one tool, more than a handful of viewers, on a schedule rather than per-action, and you want the durability and audit trail of warehouse-mediated data. It's the right shape for production reporting, cross-tool consistency, and any organization that's serious about not losing the value of their Tableau data sources to vendor lock-in.
In practice, most organizations run both. Path A for the action-time enrichment use cases, Path B for the canonical metric distribution. The two patterns aren't competing with each other; they solve different problems.
The recap
To put this in one paragraph: VDS lets you call your Tableau data sources from anywhere that can make an HTTP request. Snowflake's external access integration lets you make HTTP requests from a Python stored procedure. Combine the two, run them on a schedule, and you have a pipeline that pulls Tableau-canonical math into a warehouse table. From there, anything that can read your warehouse can read the canonical numbers. Sigma gets it for free. dbt gets it for free. Reverse ETL, ML, other BI tools, embedded analytics, internal apps, all get it for free. Tableau becomes the calculation engine. Snowflake becomes the distribution layer. Your data sources stop being locked rooms.
If you're already running Tableau and you're already running Snowflake, you can build this in an afternoon. Everything you need is above, and it's been acceptance-tested against the Superstore demo data source. West region reconciles to within nine cents.
If you want help thinking through how this would fit your stack, or you're hitting a snag we covered above, drop us a note. And if you want to be notified when the Sigma side of this demo lands, subscribe to the Petalworks Terrace newsletter.
Cogs & Roses is a Dallas-Fort Worth data consulting firm. We help organizations get the most out of Tableau, Sigma, and Snowflake, with an emphasis on getting the architecture right before chasing visual polish. If your stack has a metric drift problem, a vendor lock-in concern, or a reporting layer that's becoming a single point of failure, we'd like to talk. www.cogsandroses.com.

A publication by Cogs & Roses